")
 Argentina. The consultancy specialized in Trade Marketing and Market Consulting studies, IntegraGO, carried out a new comparative analysis of prices at the regional level in seven categories: audio, headphones, gaming, computing, smartphone, smartwatche and video, taking the same products and their price in dollars (official quote in each case).
More than 1000 prices, seven categories and sub-categories, 14 brands and 60 products were surveyed in 38 stores in Argentina, Brazil, Chile, Uruguay, Mexico, Colombia, Peru and the USA. The prices correspond to the month of December 2015.
Again Argentina was ranked number 1 in the ranking of the most expensive countries in the region in technological products, with a difference of +123% with respect to the most economical (USA) and 50 percentage points above the second (Uruguay +73%). In turn, Argentina is 89% more expensive than Brazil, 88% more than Chile, 87% more than Peru and 98% more than Mexico, as can be seen in the following table.
From the adjustment in the exchange rate in Argentina, a decrease in price variations (in dollars) can be evidenced with respect to the measurement made in August 2015, where the same categories were investigated and a new one (audio) was included. As a result of this, a greater price competitiveness in USD is visualized, when calculating the price variation using the current exchange rate as a reference.
When comparing the values obtained in August 2015 and December 2015, at the new exchange rate, there is a decrease in the percentage of price variation in 5 of the 7 categories studied (audio is a new category), only showing growth in the price gap for the Video category and as a result of a technology update in devices.
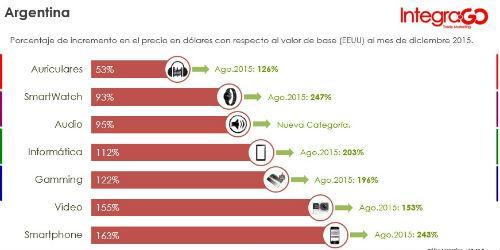
The Smartphones and Video categories are the ones with the greatest difference with respect to the base price (USA), in the first case with an increase of 163% and in the second of 155%. Then it is followed by Gaming with a 122% increase, taking as a reference the current value of the dollar in Argentina (After the elimination of exchange control)
The Headphones category is the one that has the least impact on the average final prices, leaving Argentina at 53% above the cheapest followed closely by Brazil that shows a 50% variation.
In the most specific analysis, in the Gaming category (Accessories, Consoles and Games), Uruguay is the one that ranks as the most expensive country in the region with 126% above the reference price (USA). It is followed by Argentina, 122% more expensive, Chile (38%), Mexico (33%), Peru (29%), Brazil (16%) and Colombia (14%).
The Headphones category is the one that has the least impact on the average final prices, leaving Argentina at 53% above the cheapest and only 3 percentage points from Brazil that evidences a 50% variation. Then there are Uruguay (22%), Chile (20%), Mexico (14%), Peru (8%) and Colombia (7%).
In this category is the product with the lowest cost difference registered for Argentina: the Sony headset (MDR-ZX310), whose cost varied by 3% compared to the best price surveyed (USA).
In Informatics, Argentina is also the most expensive country. Compared to the United States, in this category prices are on average 112% more expensive. There is also a wide difference with Uruguay, the second most expensive country in this sector, which has prices 49% more expensive than the reference. It is followed by Chile (41%), Peru (35%), Brazil (23%), Mexico (19%) and Colombia (1%).
In Smartphone, from the most expensive to the cheapest of countries, the order is as follows: Argentina (163%), Uruguay (45%), Peru (41%), Chile (22%), Mexico (20%), Brazil (14%) and Colombia (0.42%).
In this category is the product with the largest cost difference registered: the Sony Xperia Z3 Smartphone, with 407% in relation to the best price surveyed (USA).
In Video, Argentina is 113% more expensive than the US, Uruguay 58%, Peru 42%, Chile 31%, Brazil 30%, Mexico 27% and Colombia 8%.
Finally, in Audio, Uruguay is the most expensive country in the region, with prices 100% higher than the US. It is followed by Argentina (95%), Brazil (57%), Mexico (42%), Peru (24%), Colombia (23%) and Chile (15%).